


The Critical Role of Mycorrhizal Fungi
For centuries, scientists have mapped Earth's surface in extraordinary detail. Yet what exists beneath the soil surface has remained largely overlooked. Underground ecosystems are home to 59% of Earth’s global biodiversity, including mycorrhizal networks. Yet only in the last decade have the necessary tools—environmental DNA analysis and geospatial machine learning—reached sufficient capabilities to explore hidden networks at global scales.
Mycorrhizal fungi merit special attention because they regulate entire ecosystems, bringing direct benefits to people, including:
Carbon Drawdown
Mycorrhizal fungi are a key entry point for carbon into soil systems, drawing down an estimated 13 billion tons of CO₂ from plant partners into the soil annually—about 36% of global fossil fuel emissions. This makes them essential partners in climate mitigation strategies.
Regenerative Agriculture
Plants can get up to 80% of their phosphorus from mycorrhizal fungi. Underground fungal networks help build productive soils by increasing water and nutrient retention, preventing erosion, and decreasing the amount of nutrients leached out of the soil by more than 50%.
Restoration Potential
Restoration plans that include mycorrhizal fungi can lead to quantitatively better outcomes than those that do not. Research shows that microbial restoration, when paired with traditional efforts, can increase plant productivity by more than 60%.
From Data to Action
Because we provide spatially-explicit, quantitative estimates of mycorrhizal biodiversity, our analyses can help decision makers in several key ways:
Land Managers
Protect high-value underground ecosystems that have been historically ignored, including by designing belowground fungal corridors to increase ecosystem resilience
Restoration Practitioners
Leverage fungi to restore carbon and nutrient flows in degraded underground ecosystems, including by developing baselines and setting area prioritization for recovery
Policymakers
Incorporate fungi in global conservation frameworks (e.g., CBD Global Biodiversity Framework 30x30) and climate-related initiatives including environmental law, governmental compliance, and impact assessments
the Public
Explore interactive maps of local ecosystems and leverage this information to advocate for the protection of underground biodiversity
Our Methods and Focus
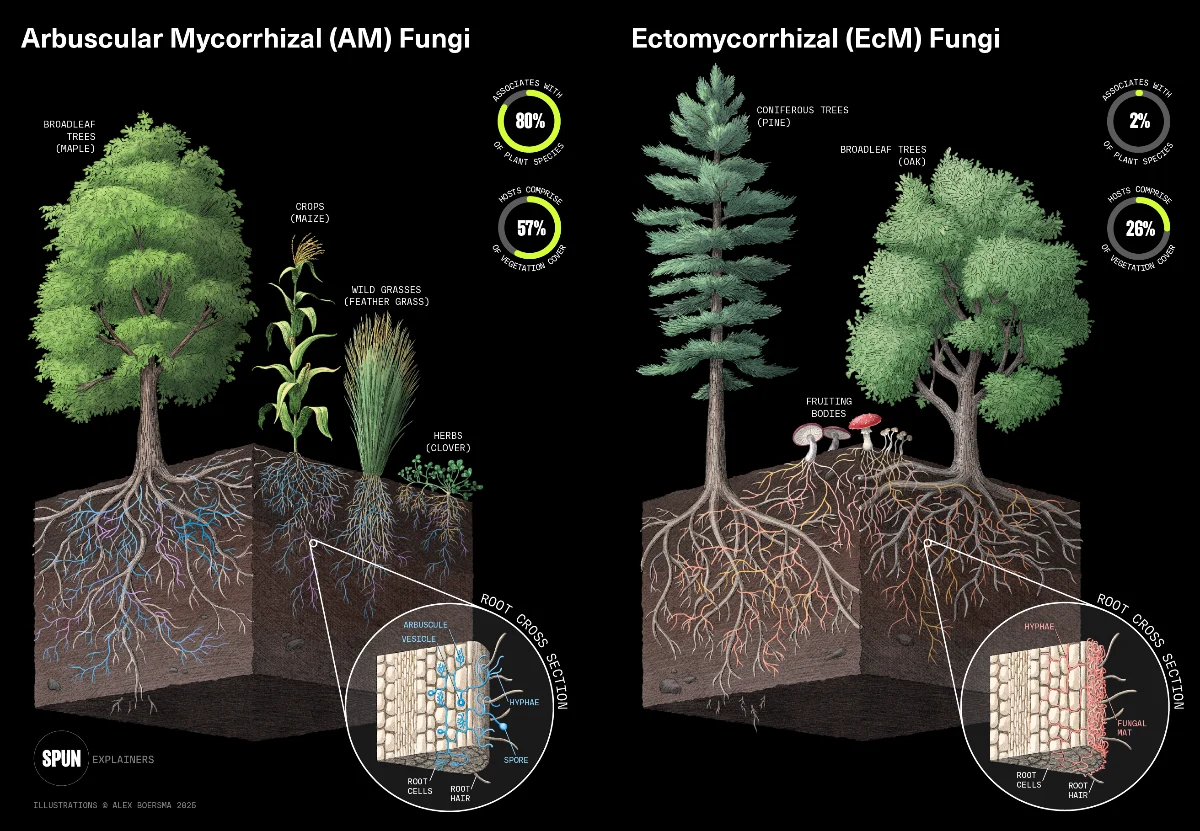
Our mapping work is built from an extensive global dataset of fungal environmental DNA (eDNA). We focused on two main types of mycorrhizal fungi:
ARBUSCULAR MYCORRHIZAL (AM) FUNGI
These form associations with approximately 80% of plant species, dominating in tropical forests, grasslands, and croplands.
ECTOMYCORRHIZAL (EcM) FUNGI
These form associations with only about 2% of plant species, but their host plants comprise over 25% of global vegetation and dominate high-latitude forests.
Using advanced machine learning, we analyzed relationships between fungal biodiversity and 22 key environmental variables including climate, soil properties, topography, and human land use. This approach allowed us to create high-resolution (1 km²) global maps of mycorrhizal fungal diversity.
Mapping Workflow
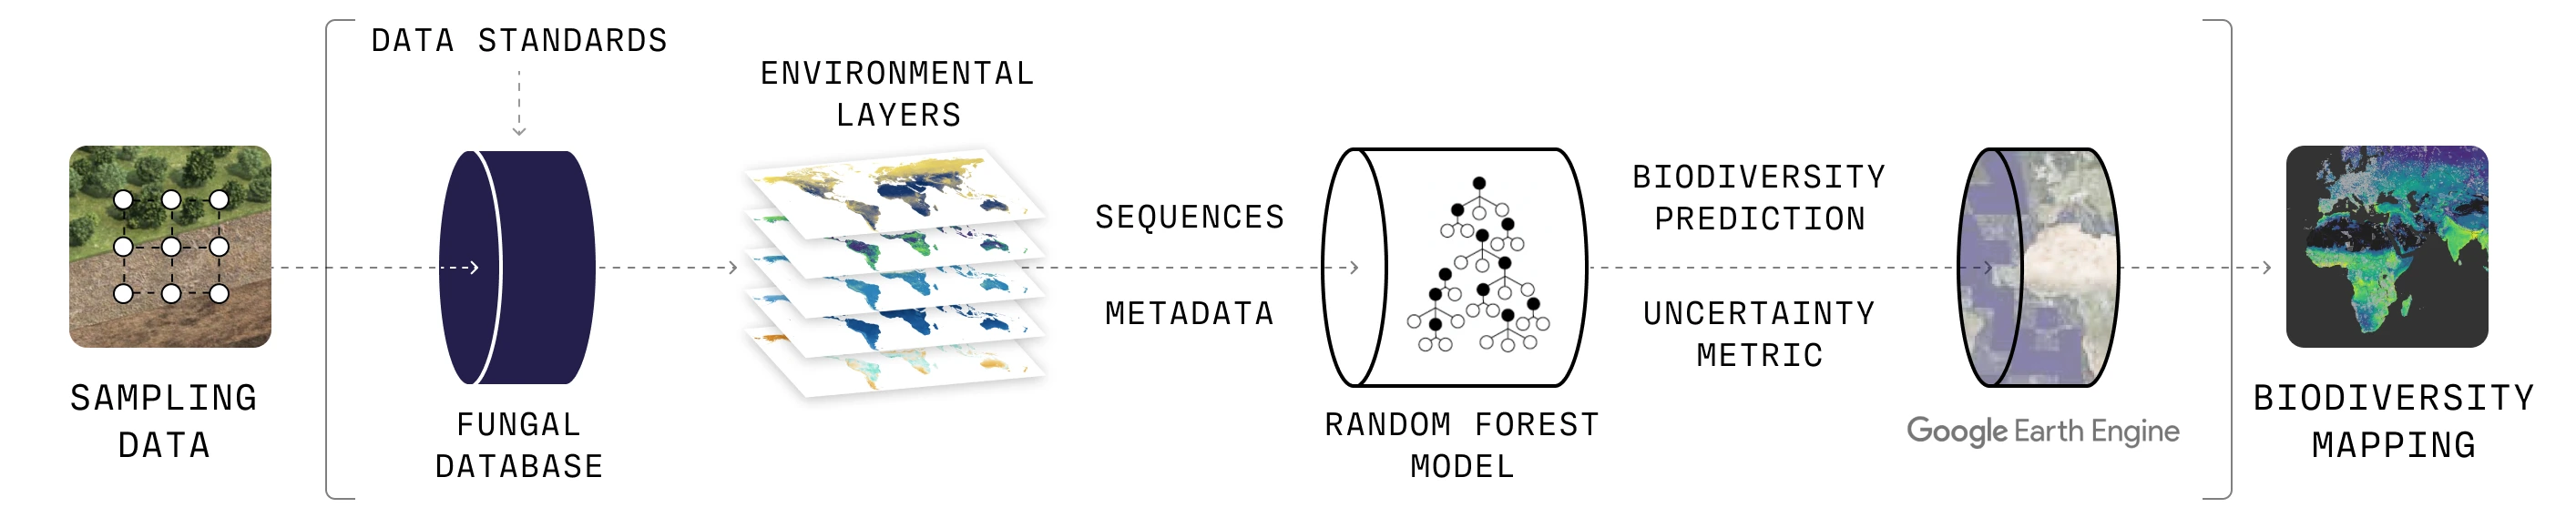
Next, we created detailed uncertainty maps. Areas with higher uncertainty typically reflect regions underrepresented in global soil biodiversity data, such as parts of northern India, the Tibetan plateau, and the Amazon rainforest for AM fungi. These uncertainty maps help prioritize future sampling locations, and guide users on when to exercise caution with our predictions.
What We Discovered
Plant diversity is not a straightforward indicator for mycorrhizal diversity
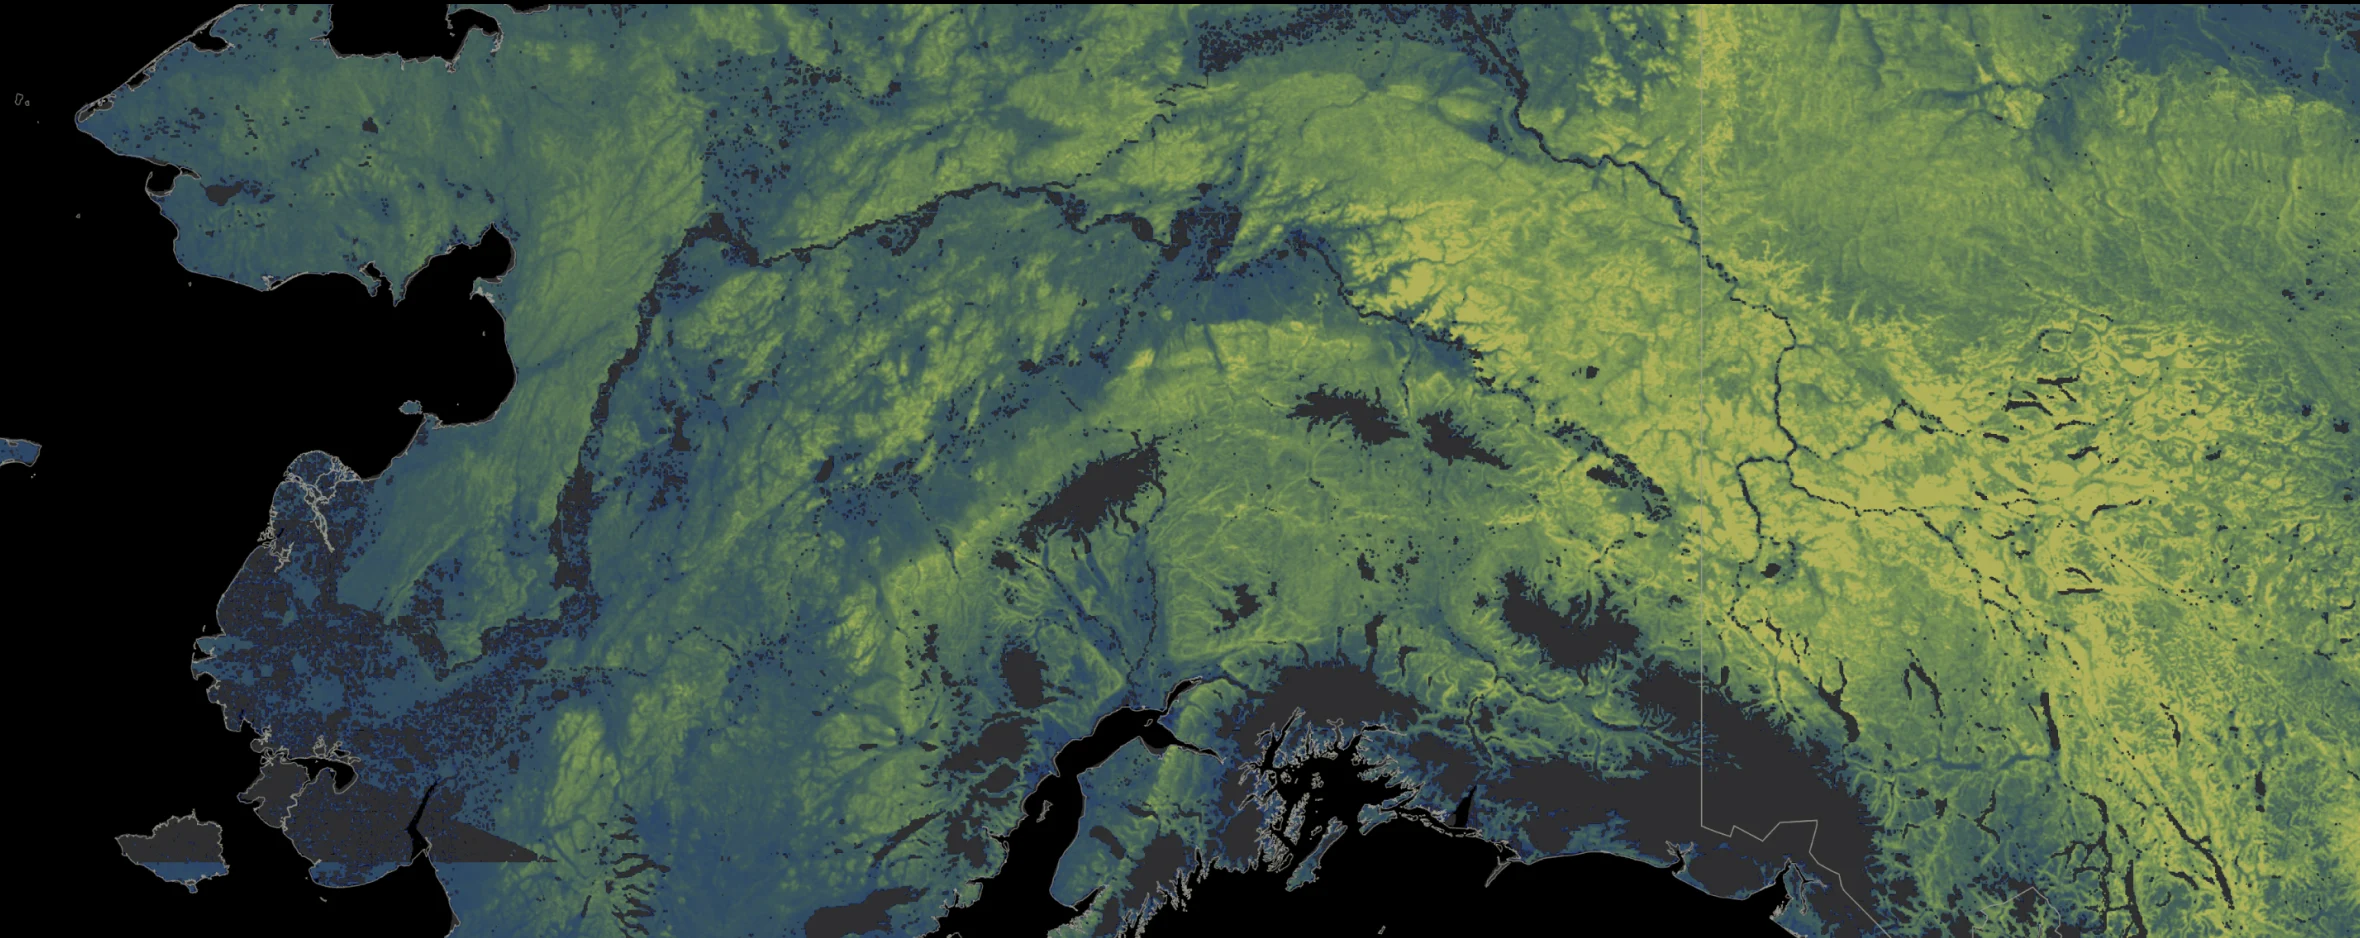
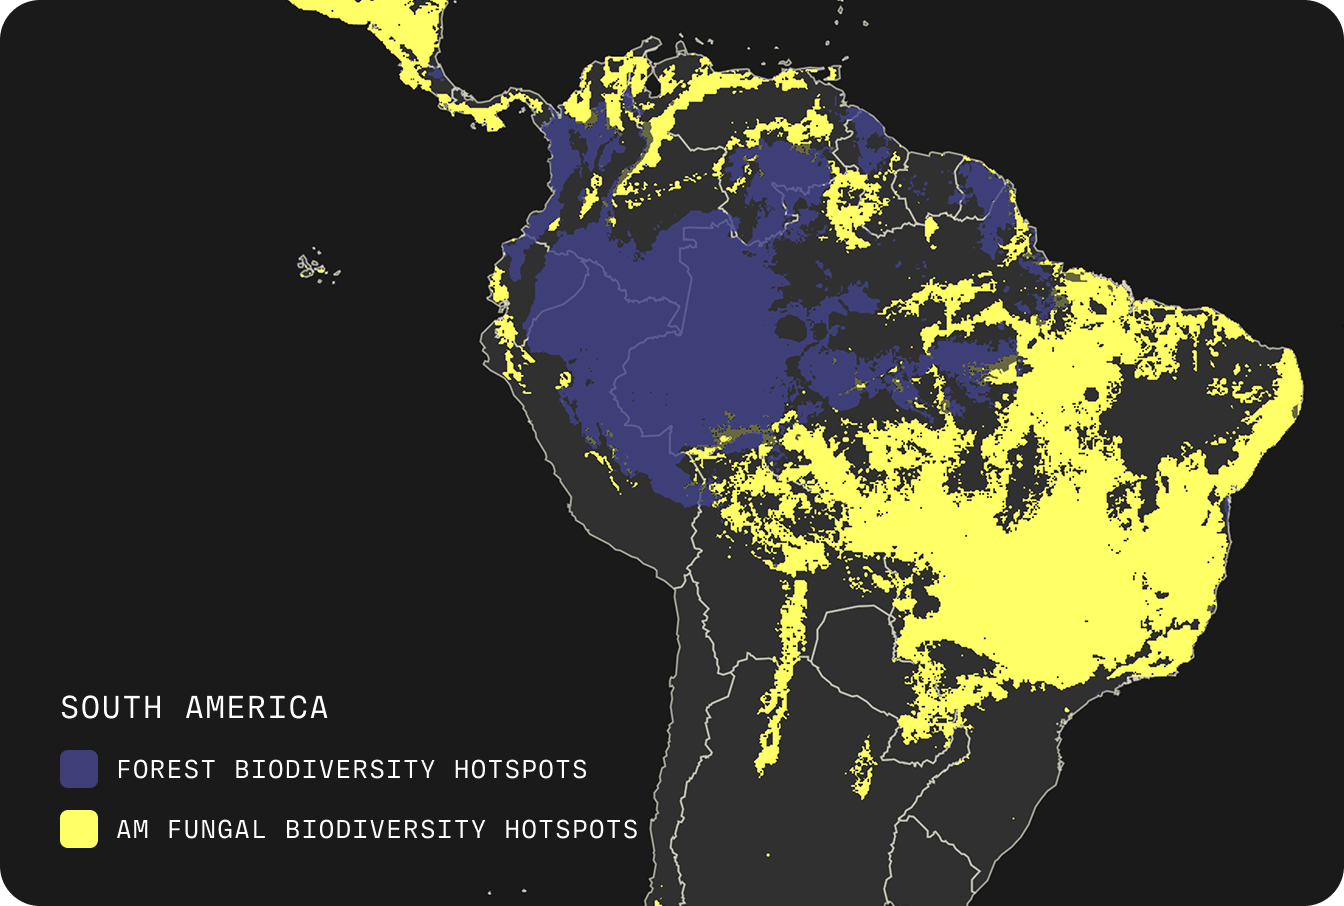
Areas with high plant diversity do not necessarily harbor the richest mycorrhizal communities. Our models revealed that plant diversity was not a major predictor of mycorrhizal richness. This disconnect is strikingly illustrated by the Amazon rainforest: despite its extraordinary plant diversity, the surrounding savanna ecosystems in Brazil's Cerrado are predicted to contain some of the most diverse AM fungal communities on Earth. Similarly, the underground ecosystems of Siberian and Canadian boreal forests support extremely rich ectomycorrhizal communities. These soil systems can house up to 100 ectomycorrhizal fungal species in an area smaller than half a tennis court, despite having relatively low plant diversity. These findings suggest that conservation strategies based solely on aboveground biodiversity could overlook crucial underground ecosystems.
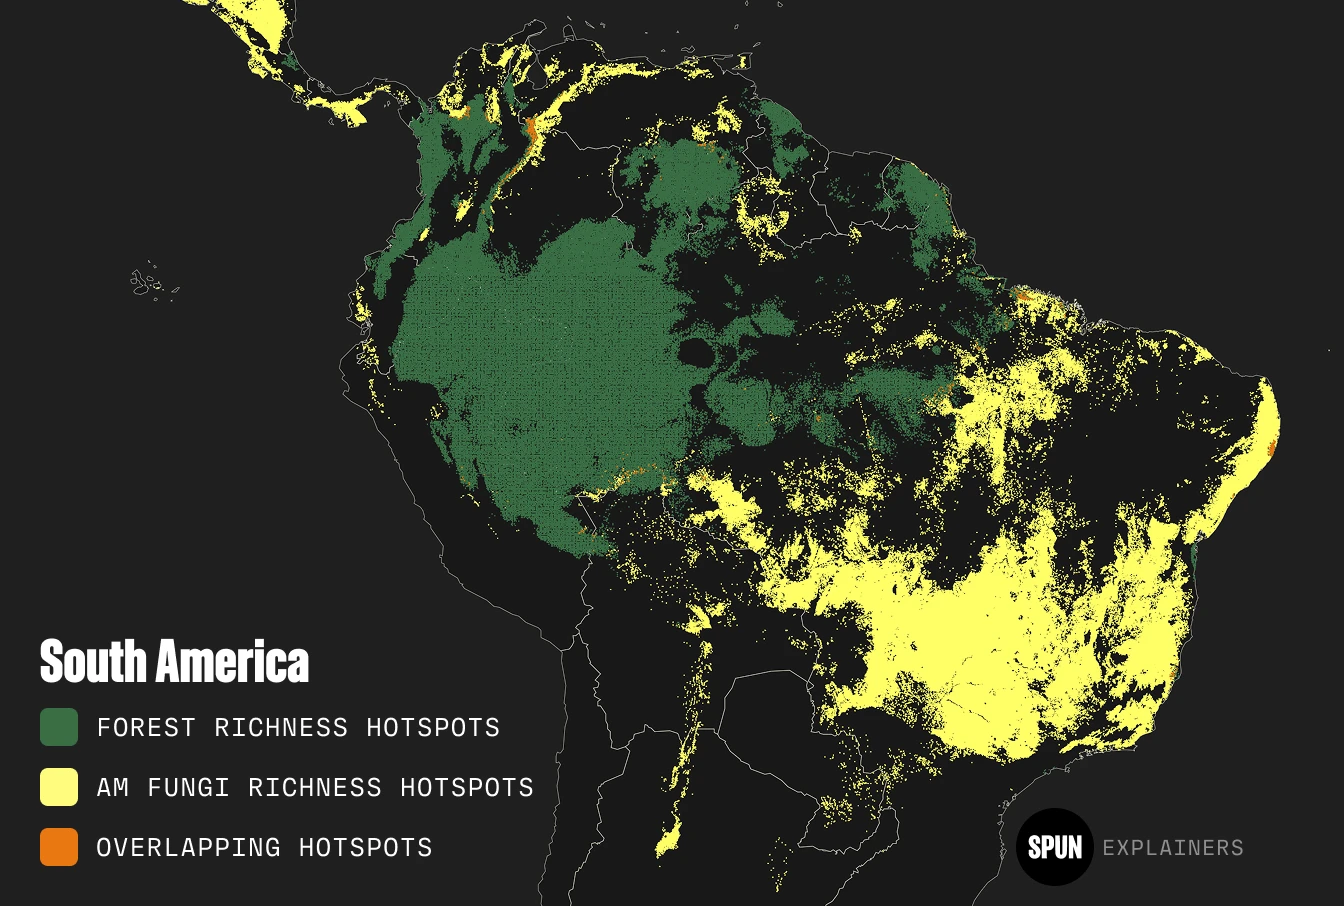
Biodiversity hotspots of arbuscular mycorrhizal fungi span diverse ecosystems
AM fungi, which associate with grasses and most tropical plants, show higher diversity in tropical regions like Southeast Asian forests, Guianan Highlands moist forests, and the Brazilian Cerrado. These areas may contain more than 60 AM fungal species per soil sample. These fungi form partnerships with most crops, making their conservation directly relevant to global food security.
Hotspots of endemic mycorrhizal fungi require special attention
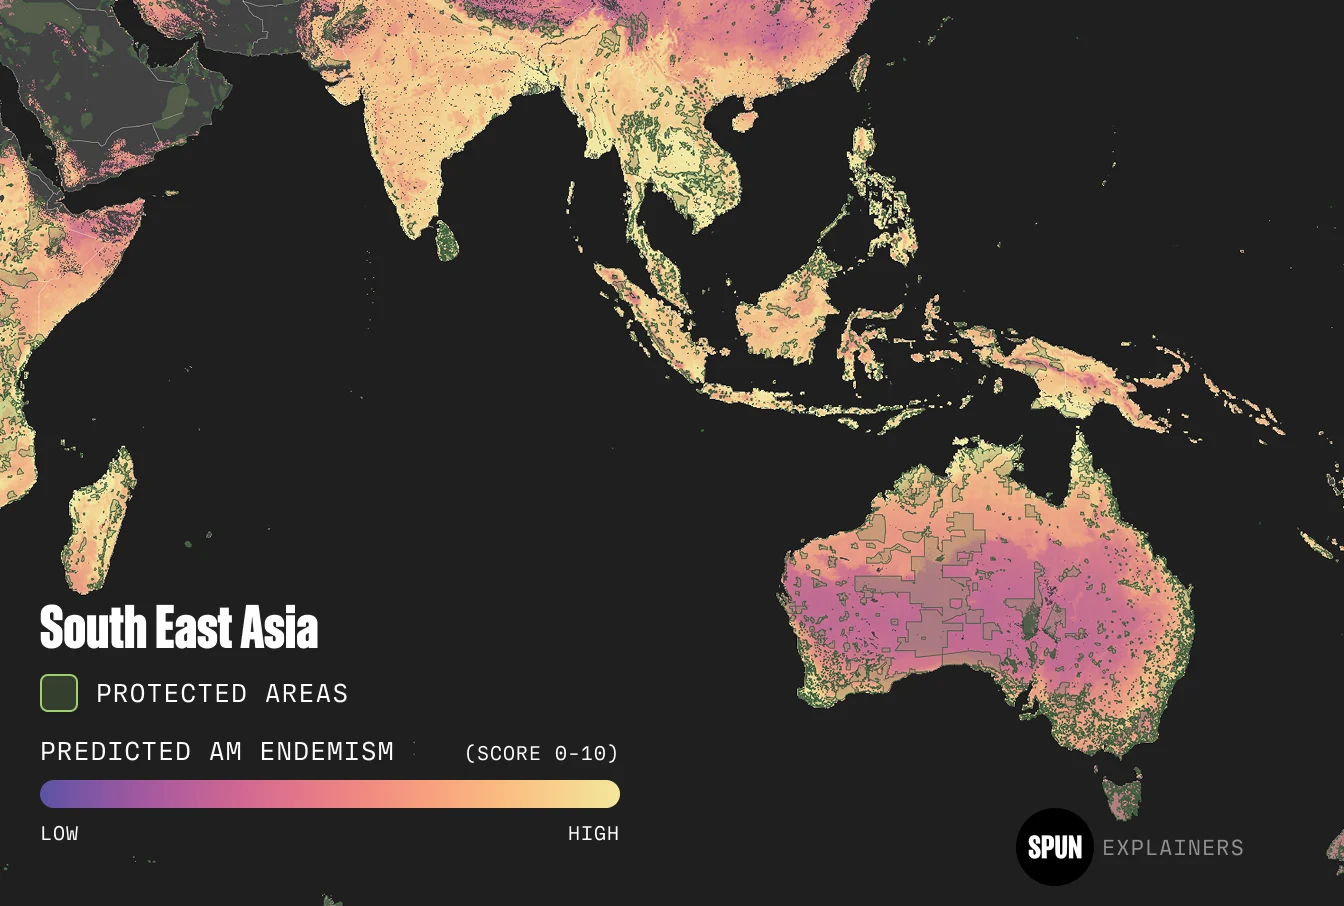
Areas with rare or endemic fungi (those found only in specific regions) do not always overlap with overall mycorrhizal biodiversity hotspots. We found hotspots of AM fungal rarity in tropical and subtropical forests in the eastern Amazon basin. For EcM fungi, we identified significant endemism hotspots in tundra ecosystems at high latitudes, tropical moist forests in China's Yunnan-Guizhou plateau, mainland South East Asia, montane rainforests across Indonesia, and Guianan highland forests in Venezuela.
Climate factors influence different fungal types in opposite ways
Mean annual temperature and potential evapotranspiration emerged as particularly significant predictors in our models. Higher values predicted greater arbuscular mycorrhizal fungal richness but lower ectomycorrhizal fungal richness. These data will help us predict the health and functioning of different types of mycorrhizal fungi as they respond to climate change.
Most mycorrhizal biodiversity hotspots are unprotected
Globally, only 9.5% of mycorrhizal richness hotspots are found in protected habitats, including just 5.1% (~280,000 km²) of AM hotspots and 13.9% (~756,000 km²) of EcM hotspots. Now, action is needed to incorporate our findings into national, regional, and international biodiversity law and policy. For example, the Ghanaian coast is a global hotspot for arbuscular mycorrhizal biodiversity. But the country’s coastline is eroding at roughly two meters per year. Scientists worry this critical biodiversity will soon be underwater unless the coasts are managed differently.
unprotected hotspots

percentage of global hotspots protected


Vertebrates include amphibians, birds, mammals, and reptiles. Vertebrate biodiversity data source: IUCN Red List of Threatened Species. Tree biodiversity data source: Jingjing Liang et al., “Co-limitation towards lower latitudes shapes global forest diversity gradients” (Nature Ecology & Evolution 6, 2022).
What’s Next?
Our aim is to ensure underground biodiversity becomes as fundamental to environmental decision-making as satellite imagery. To achieve this vision, we have planned several critical milestones on our roadmap:
Phase 1: Discovery Zones
We are targeting Earth's most extreme and understudied ecosystems including drought-stressed deserts, salt-affected coastal areas, pollution-impacted industrial sites, and post-fire recovery zones where fungi may have evolved unique resistance mechanisms that could advance restoration and climate adaptation strategies.
Phase 2: Impact Forecasting
As the resolution of mapping increases, we will shift to explore how mycorrhizal communities respond to changing climate extremes. We will continue to model how climate change, pollution, deforestation, intensive agriculture, and other human activities are reshaping underground biodiversity over time.
Phase 3: Ecosystem Functions
In the most ambitious phase of our roadmap, we will move beyond mapping biodiversity to understanding the precise functions of mycorrhizal species. Our ecosystem function maps will show how mycorrhizal communities contribute to carbon sequestration, enhance drought resilience, support plant productivity, and provide other critical ecosystem services.
Join Us in This Work
Use Our Tools and Data
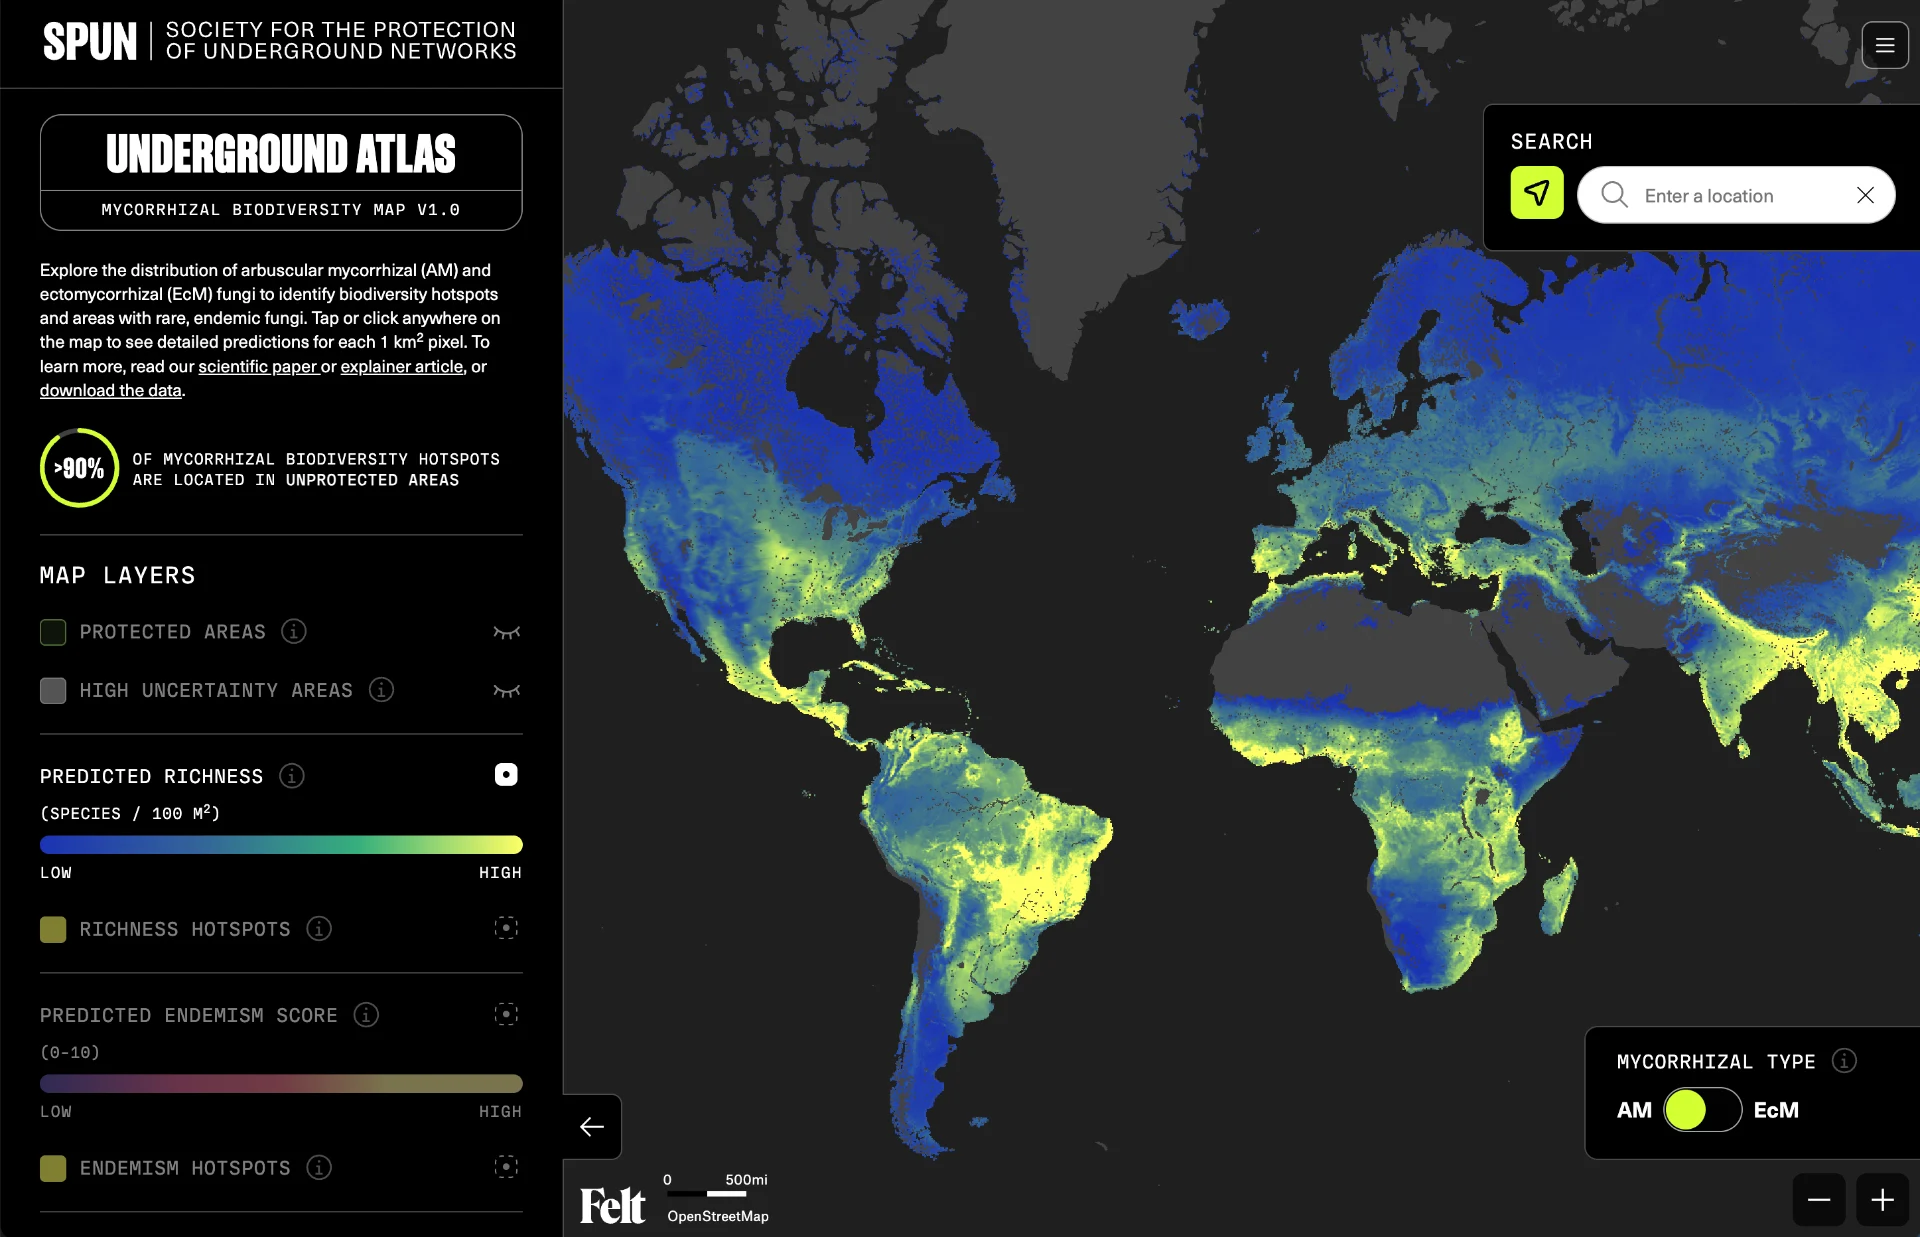
Explore the Underground Atlas or download the data for your own analyses.
Contribute to the Research
Apply to become an Underground Explorer or Science Associate.
Get Involved
There are so many ways that you can take action for fungi. Visit our Get Involved page to learn more.
Lead funders


